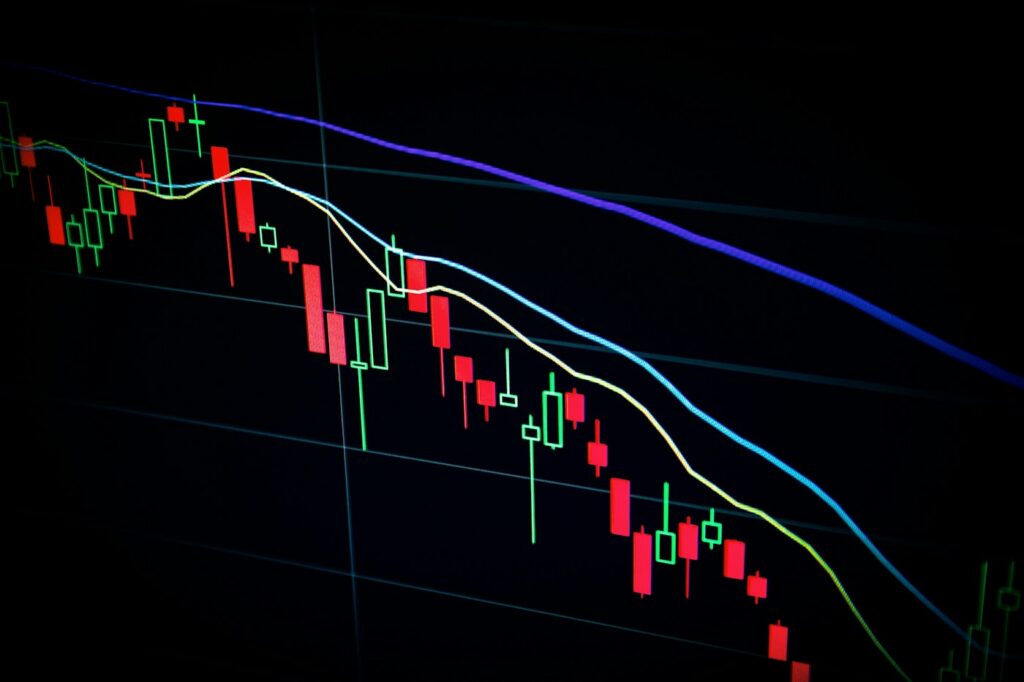
Time periods, units and comparisons can change what a familiar-looking line really says.
Check the label
Start with the title, source and unit. A chart of a total is different from a chart of its growth rate. A price level is different from the rate at which prices change. The distinction should be clear before the direction of a line becomes an argument.
Check the time
The start and end dates affect the impression a chart creates. A short interval can highlight a movement that looks different over a longer period. Ask why that interval was chosen and whether the comparison uses the same frequency and definition.
Look at the scale
Read the axis rather than judging only the apparent steepness of the line. Check whether it starts at zero and whether units change across panels. These choices can be legitimate, but they should not be invisible to the reader.
Follow the source
A screenshot is a starting point. Look for the underlying release, including notes on coverage and revisions. A persuasive interpretation explains what the series measures, what it cannot establish and which part of the conclusion is analysis rather than a fact printed in the chart.
An original editorial perspective from The Greater India’s launch collection. This piece sets out a way to understand or report the subject; it does not describe a newly reported event or an invented interview.